Category: Article
What are DART studies?
DART, or Developmental and Reproductive Toxicology, studies assess critical information about drug exposure effects before and during mating, and evaluate maternal and fetal changes during gestation, identifying any alterations in the development of the progeny following birth. In essence, these studies elucidate the toxicity effects of the compound in question.
Why are the challenges of assessing risks by toxicity?
Depending on when the exposure takes place, different organs or aspects of development may be affected and these periods of time are the critical periods of susceptibility. Toxicants can be made up of various agents initiating a wide variety of mechanisms in the body. They may also affect only certain populations, based on genetic differences or varying health histories. The potential mechanism of action of the toxicant must be understood at many levels of the biological organization (pathways, cells, etc.) to truly understand the overall processes of developmental toxicity.
How are DART studies different from general toxicology studies?
DART studies are not separate from different from standard toxicology in that they have the same application of toxicological principles such as toxicokinetics (TK), pharmacokinetics (PK), ADME, and other such parameters. There is however special emphasis on the timing and duration of exposure, dose level, and the consequence on the mother and fetus both.
Why are DART studies essential?
DART studies assess information about how exposure to a drug effect different developmental stages. Such altered development may be manifested as death, malformation, growth retardation, or functional deficits. FDA guidance recommends certain international standards for the harmonization of the assessment of nonclinical developmental and reproductive toxicity testing and deems that these studies are required before human clinical trials and marketing authorization. In order to initiate clinical trials for women of child-bearing potential (WOCBP), the FDA requires the initiation of preclinical developmental and reproductive toxicology (DART) studies using mammalian research models.
What is the typical DART program?
The typical species for DART studies include rats and rabbits via multiple routes of administration but other research models are also available for DART, such as mouse, hamster, dog, minipig, and monkey. There are a few types of DART studies and each focus on studying a different phase of the developmental process:
- Fertility and Early Embryonic Development (FEED) study (Segment I) evaluates the effects on mating, estrous cyclicity, spermatogenesis, and ability to produce a viable implant. At Frontage, we assess sperm count, motility, and morphology are assessed using a Hamilton-Thorne Analyzer.
- Embryofetal Development (EFD) study (Segment II) demonstrates the effects of gestational exposure on the pregnant female and the developing fetus during the organogenesis period. This study evaluates fetal development and survival.
- Pre- and Post-natal (PPND) study (Segment III) quantifies the effect of gestational and lactational maternal exposure on embryonic development, the process of parturition, and the development of the offspring.
When should we conduct DART studies?
The EFD and FEED designs can be run in parallel and are generally required for Phase 2 Clinical Trials. PPND studies are usually required for Phase 3 Clinical Trials but can be done earlier if needed.
A Partner for DART Studies
Choosing a CRO like Frontage offers you access to highly trained expert scientists with a long history of successfully performing specialized toxicology studies, including regulated DART studies. At Frontage, we offer single and multi-generation studies and have the capability to conduct DART studies following the ICH S5 (R3) Guideline. Request a quote for a DART study.
References
- Developmental and Reproductive Toxicology: A Practical Approach (Third Edition) by Ronald Hood
Microsampling Overview
Dried blood spots (DBS) and capillaries/capillary microsampling are the two most used microsampling techniques. In this article, we will give an overview of current microsampling techniques, the advantages, and challenges involved, and showcase how microsampling can generate high-quality bioanalytical data and accurate TK/PK profiling. Microsampling is a process through which low-volume samples (<100 μL) of fluid from the human body are captured for analysis. This enables minimally invasive analyses of samples when they are present in low volumes.
First used by Dr. Robert Guthrie for detecting metabolomic disorders in newborns in the 1960s, the dried blood spot (DBS) technology allowed routine neonatal testing for phenylketonuria (PKU) worldwide. In the drug discovery world, DBS was not considered for pharmacokinetic/toxicokinetic (PK/TK) studies until recently. In a 2010 study, a 10-time-points serial mouse PK study was done using microsamples and DBS, showing that serial microsampling and DBS provided quality serial PK profiling data in comparison with plasma-based composite studies. It was determined over time that DBS can reduce the sample volume needed by 75% and generate reliable PK data for use.
Microsampling in Bioanalysis
Current pharmacokinetic and toxicological studies have an increasing demand for the volume of blood required from study animals, especially when the study involves small rodents. A typical toxicology study has satellite groups of rodents, with each group having multiple animals, to achieve enough volume for analysis. Individual variance between animals can be high and animal physiology is affected at each draw. Altogether these affect the accuracy and efficiency of the studies.
The FDA ICH M3 guidance recommends a reduction of “[…] the use of animals in accordance with the 3R (reduce/refine/replace) principle” and microsampling techniques help preclinical researchers follow this. As a response, microsampling techniques have been introduced into bioanalytical studies. In a poll conducted during our webinar on DBS and Capillary Microsampling, a majority of the respondents reported ethical concerns and efficiency to be their drivers of interest in microsampling for bioanalysis.
Advantages of Microsampling
Previous studies have shown that microsampling greatly reduces blood sample volume needed by 80%. Because of this, fewer rodents are needed when conducting toxicokinetic (TK) studies, a number reduced by 75%. This reduction has allowed for serial TK/PK profiling, whereas when conventionally used plasma samples were collected, only composite profiling had been possible. During composite profiling, several animals need to be bled at different time points, and the large variability between animals added another factor to consider. Serial profiling also allows the generation of much more reliable and consistent PK profiles. For clinical studies, DBS sampling is especially patient-friendly for pediatric or studies with critically ill patients.
Handling DBS samples is also much simpler than traditional procedures. There is no centrifugation needed as is required when harvesting plasma and there are no requirements to aliquot or freeze samples as with plasma, saving freezer space and eliminating the need for cold storage during shipment. DBS sampling is also a safe technique because all pathogens, including HIV and HepB, are inactivated upon contact with the filter paper used. This ensures as well that the personnel handling the DBS samples are also safe. The costs of such methods are not low simply because of a reduction in R&D costs due to low volumes and fewer rodents needed. In fact, because DBS samples are not considered biohazardous and do not require special carriers, shipping costs are lower than they would be for plasma samples.
Challenges of Microsampling
In a poll conducted during our webinar on DBS and Capillary Microsampling, greater than 60% of the attendees reported “sample size” as their biggest challenge during method development for microsample bioanalysis. While assaying with smaller sample volumes is desirable for many reasons, the low volume limits sensitivity testing.
60% of the attendees reported “sample size” as their biggest challenge during method development for microsample bioanalysis.
Frontage Webinar Respondents, DBS and Capillary Microsampling
Differences in the sample quality can also be seen in spot-to-spot variation. The hematocrit (Ht) effect refers to the volume of red blood cells in the blood sample which can affect how well the blood spreads on the filter, causing the spot size to be either bigger or smaller. This can affect the quality and reliability of the blood samples as well as the quantification of the sample.
While most compounds are stable in DBS, compound stability can be an issue when handling compounds that are unusual or unstable. In such cases, applying inhibitors or stabilizers is inconvenient due to the design.
Choose a Partner with Microsampling Experience
When assessing DBS for LC-MS/MS method validation, it is critical not only to validate the parameters traditionally validated for plasma samples but also to additionally evaluate the spot size, sampling location, and hematocrit effect. DBS is a special kind of matrix because, unlike other matrices, it cannot be simply vortexed or diluted and homogeneity is difficult to ensure. At Frontage, we have developed special preparation and extraction techniques to prepare standards and QCs to ensure robust performance and produce clean data when working with microsampling techniques. We have developed a unique sample-handling method utilizing pre-scored capillaries developed in-house, at Frontage Laboratories (PA, USA). Learn more by reading our case study on this technique, and how it overcomes some of the limitations of the conventional capillary microsampling approach and supports regulated bioanalytical studies.
Case Study: Capillary Microsampling (CMS) Technique for Low-Volume Bioanalytical Plasma Analysis in Support of a Regulated Study: Frontage bioanalytical scientists developed a novel procedure for the collection and isolation of microvolumes of plasma using plastic instead of glass capability tubes to overcome issues associated with the typical glass CMS technique.
Flow cytometry is an exceptionally useful methodology used in all stages of drug development, and current instruments that run flow cytometry offer flexibility, sensitivity, reproducibility, and high-throughput assessments to deliver accurate data. A flow cytometer works by processing an injected sample that contains fluorescently labeled cells, analyzing each cell one at a time, to gather large amounts of high-quality data to sort and characterize and identify cells.
In early drug discovery, flow cytometry can be used to analyze cell populations and detect rare cell types rapidly. In later stages of the drug development process, it can be used to monitor the efficacy and safety of drugs in clinical trials, often also used for identifying biomarkers for diagnosis and prognosis. The value of the data gathered is tremendous and can be used across every phase of the drug development program, helping pharmaceutical companies develop sharper drug development strategies. In this article, we focus on the applications using flow cytometry in the early stages of drug discovery.
Target-based screening is one such application where potential receptor-ligand interactions that may affect binding interactions between targeted molecules, can be identified. Target multiplexing allows high throughput screening and offers cell-by-cell analysis. Primary cells and tissues may be screened providing insights into dose-based responses, toxicity profiling, and more. Recent advances in instrumentation have allowed researchers to study critical cell populations with minimal sample waste. In addition to protein-protein interactions, flow cytometry advances also shed light on metabolic activity and cell viability. By using viability stains and cell proliferation assays, live and dead cell populations can be separated for cleaner data. Phenotypic screening involves screening compounds for the ability to deliver a particular phenotype that is associated with a therapeutic effect and is typically used for small molecules.
Biologics screening is another area where this platform has showcased efficiencies. As one of the fastest-growing therapeutic modalities, biologics covers many therapeutic approaches with varying functionalities. To develop such antibody-based therapeutics, flow cytometry methods are used to quickly select and characterize candidates with better target reactivity and functionality. In an application used at GlaxoSmithKline, the objective of the study was to assess multiple hybridoma supernatants for antibodies binding to 1) cells expressing a human protein of interest, 2) negative control cells expressing a related but different protein, and 3) cells expressing the orthologous protein from two different animal species of interest. To accomplish this, the four different cell populations were barcoded by incubation with four different concentrations of a fluorescent dye, then incubated in wells together with hybridoma supernatants and reporter antibodies that had their own distinct fluorescence signature. Multiplexing techniques help researchers screen large pools of candidates to pick out lead candidates that exhibit cross-reactivity against multiple species early in the discovery process.
In early drug discovery, flow cytometry is a technique used to isolate cells containing specific targets, characterize small molecules, identify biomarkers, analyze immune responses, and more. No matter the stage your molecule is in, Frontage’s scientists can build custom assays to deliver the results you need to advance your product. Contact us for your custom assay development projects.
Nanoemulsions have been of great interest to pharmaceutical companies as the world’s nanotechnology industry could be worth 80 billion dollars and nearing a 17% growth rate by 2024. Nanoemulsions are a special type of emulsion, which is made up of very small droplets of oil and water. These droplets are so small that they can pass through cell membranes, making them ideal for use in product development. Nanoemulsions are particularly interesting when developing liquid formulations of poorly water-soluble drugs for oral or injectable administration.
[PODCAST] Sterile Product Development of Poorly Water-Soluble Drugs
But first, what are Emulsions?
An emulsion is a mixture of two or more immiscible liquids which is stabilized by an emulsifier. Emulsions have an oil phase and an aqueous phase where one of the phases is a continuous phase and the other is the dispersed phase. Depending on the continuous phase, emulsions can be classified as either water in oil (oil as continuous phase) or oil in water (water as continuous phase) emulsions.

Emulsions have various practical applications in agriculture, cosmetics, drugs, and food products. Specifically, in the pharmaceutical space, some emulsions are used to deliver active pharmaceutical ingredients (APIs) in topical, oral, nasal, ophthalmic, or injectable dosage forms.
Nanoemulsions in Drug Delivery
Nanoemulsions are liquid-in-liquid dispersions with droplet sizes of 20-500 nm. Different from microemulsions, which are thermodynamically stable, nanoemulsions are kinetically stable and more resistant to physiological changes such as dilution and pH changes which is more advantageous from a formulation perspective. Producing stable nanoemulsions requires high-energy manufacturing methods such as high-pressure homogenization and ultrasonication.
| High-Pressure Homogenization | Ultrasonication |
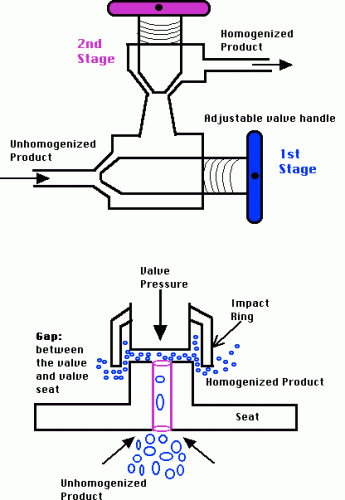 High-Pressure Homogenization (Source) | 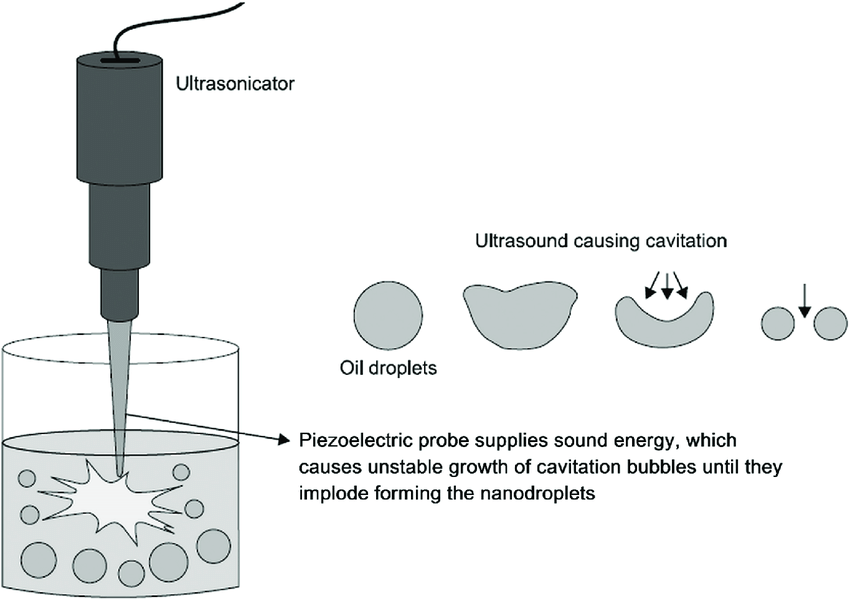 Ultrasonication (Source) Ultrasonication (Source) |
Nanoemulsions, being so small, show enhanced functional potentials such as enhanced stability, surface area, optical transparency, rheology, and more. Oil-in-water (O/W) nanoemulsions are specifically used to carry the high load of water-insoluble drugs which can be dissolved in the oil core. Oil-in-water nanoemulsions are also known to stabilize drugs that may experience hydrolytic and oxidative degradation.
For a complete overview of challenges and future trends in sterile nanoemulsions, check out our webinar on Sterile Nanoemulsion Product Development.
The lower particle size and high effective surface area increase the bioavailability of the drugs nanoemulsions carry. O/W nanoemulsions are also excellent carriers for topical and transdermal drug delivery. Nanoemulsions can dissolve nonpolar active compounds, an important factor in being chosen as drug and bioactive compound delivery systems. Parenteral delivery routes have been used in supplying nutrients, controlled drug release, and vaccine delivery. Nanoemulsions are particularly of interest because they can be developed cost-effectively and on a larger scale, in many dosage forms such as oral, parenteral, topical, and ophthalmic.
Some examples of drugs using nanoemulsions for transdermal drug delivery are caffeine, aspirin, and insulin.
Choosing a Nanoemulsion Product Development Partner
When choosing a partner for product development, it is critical to work with a team that can develop GMP manufacturing processes to help ensure a high-quality final product for clinical trials. Frontage facilities have been designed for flexibility and offer a variety of dosage forms. Frontage’s formulation development team also can handle highly potent compounds and DEA-controlled substances and is a preferred choice for Sponsors looking to develop finished products supporting IND, NDA filings, and generic ANDA filings. Learn more about our vast formulation development capabilities and tell us more about your nanotechnologies.
In September 2022, Frontage Central Labs was awarded the prestigious CAP prestigious from the College of American Pathologists (CAP), certifying our excellent quality of laboratory services. Read the complete news story here:
What is CAP accreditation?
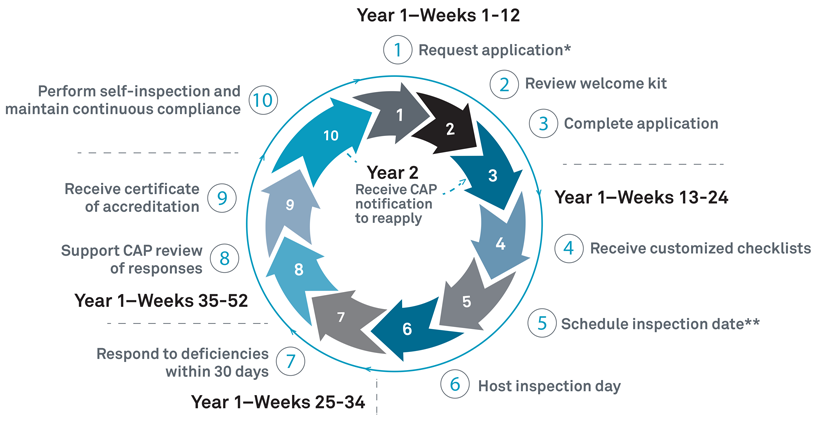
The CAP’s Laboratory Accreditation Program is known as the “champion of laboratory excellence,” and is the world’s largest board-certified pathologist organization leading improvements in the quality of services using established performance standards. “The CAP equips accredited laboratories with the knowledge, skills, and resources to remain current and relevant in an evolving health care landscape.” Only laboratories that meet the highly specific and stringent quality expectations for the CAP Laboratory Accreditation Program are awarded the accreditation. The on-site inspection happens once in two years to assess if the laboratory being tested is still compliant. This inspection typically involves checking management and staff qualifications, all laboratory instruments, facilities, and records. The CAP accreditation process nearly takes a whole year from application to the attainment of the accreditation. Having this successful inspection and accreditation highlights that Frontage Central Labs is committed to the highest standard of quality and care.
Why does CAP accreditation matter?
Patients and health care practitioners both depend on diagnostics and laboratory tests. The accreditation program ensures that the laboratory offering such services is upholding standards for high-quality testing. The accreditation program is updated regularly to align with the changes in laboratory medicine and technology and in the regulatory space. The inspections take place periodically to ensure that the laboratories being inspected remain compliant or have constructive suggested changes to work on. Frontage’s CAP accreditation provides confidence to clients when choosing Frontage for high-quality laboratory services.
“Frontage Central Labs is committed to the highest standard of quality, and we are proud to have received this accreditation.”
Dr. Nan Zhang, the CLIA Laboratory director and VP of Global Central Lab Services
“This is a truly great achievement by the Frontage Central Labs team, which we have received in recognition of the high quality of our services and scientific expertise. As always, we remain dedicated to ensuring the highest standard of patient care and safety possible.”
Dr. John Lin, EVP and Global Head, Bioanalytical and Biologics Services
Frontage Central Labs offers routine lab testing services, histology, pathology services, and more, helping assess patient health and diagnoses. Frontage Central Labs can also be found in CAP’s Accredited Laboratory and Biorepository Directory.
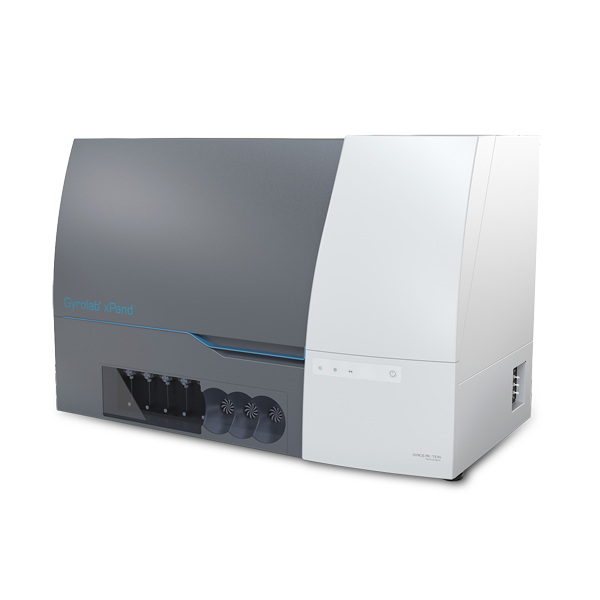
Gyrolab: The Platform
Gyros Protein Technologies AB developed Gyrolab platforms using “reproducible nanoliter microfluidics and sequential CD processing” for efficient immunoassay runs. The first immunoassay system for nanoliter-scale protein quantification was released in 2003 at Drug Development Tool (DDT), Boston. In 2009, Gyrolab xP launched a new software designed for 21 CFR part 11 compliance and extended validation support. It miniaturizes immunoassay and integrates reagents (capture and detection antibody), sample addition, and CD washing into a single machine. For pharmacokinetic (PK) studies, it has brought advantages like broader dynamic ranges, shorter time to results, reduced sample and reagent volumes, and automated programs.
Gyrolab Design
The Gyrolab system works with its proprietary CD technology engineered with highly reproducible nanoliter microfluidics. Each CD has 96/112 channels depending on the CD type and each channel has an individual sample addition inlet. Through precise, automated control of CD spin, capillary forces steer liquid flow through nanoliter-scale microfluidic structures in each CD channel and form the sandwich format. Fluorescence data is collected from the assay and analyzed using the Gyrolab Evaluator software to obtain final protein concentrations.
Challenges and Advantages of Gyrolab
Different from MSD and ELISA platforms, which use disposal tips to transfer reagents and samples, Gyrolab uses needles to transfer samples. Because of the instrument’s design, carryover contamination checks are necessary to conduct during method validation. For optimal use of Gyrolab, Frontage’s bioanalytical team shows how carryover contamination checks can be performed to ensure smooth operation.
Unlike the MSD and ELISA platforms which can handle multiple plates parallelly, Gyrolab processes CDs in a sequential manner. One CD run can take 1 to 2 hours, and the last CD needs to wait about 4 to 8 hours on the machine to be processed. In this case, samples after MRD benchtop stability need to be established to make sure samples are stable on Gyrolab while waiting for analysis. For optimal use of Gyrolab, Frontage has performed “After MRD (minimum required dilution)” stability testing to mimic the delay in loading standards.
No doubt, the Gyrolab platform has several advantages over ELISA or MSD platforms. The broader standard curve range and the proprietary CD technology which uses affinity flow-through assay reduce the background noise significantly and increase the sensitivity. It runs in a shorter amount of time and can utilize smaller sample and reagent volumes, saving critical reagents. An ideal choice for preclinical drug development animal assays, which have limited sample volume, it is also suitable for clinical projects with many samples that need to be analyzed in a short time.
Using Gyrolab for Your Immunoassays
With an increased need for high-throughput immunoassays using precious samples and uncompromised data quality in a limited time, choosing a CRO that can build quality assays and deliver robust data is critical. Frontage’s Gyrolab team has deep expertise in analyzing any peptide, protein, or antibody, and with method validation using the Gyrolab platform under GLP or Clinical environments.
Author’s Note: This article is written with support from Zhongqiang Qiu, Ph.D. from Biologics Service at Frontage Laboratories.
In the last five years, investigations of the gut microbiome, or microbiota, have skyrocketed largely due to advances in massively parallel sequencing technology and bioinformatic approaches such as the reconstruction of transcriptomes using de novo assembly in the absence of complete reference genomes. These metatranscriptomic studies of stool samples have identified and cataloged bacteria, fungi, and viruses that are common to healthy colonic microbial populations. For instance, over 35,000 bacterial species comprise the gut microbiota; although organisms belonging to the phyla Firmicutes and Bacteroidetes predominate1. Microbiome researchers have poured in a substantial body of work associating the dysbiosis of the microbiome with many pathologies including metabolic diseases, colorectal cancer, multiple sclerosis, cognitive developmental disorders, and autoimmune diseases2-10.
Advance your microbiome project using our comprehensive microbiome services.
There has been a wave of companies rushing to leverage these connections to develop novel therapeutics. In fact, over 20 well-funded start-ups have recently surfaced with the mission to harness the power of the microbiome to treat and prevent disease. Of these microorganisms-orientated companies, Vendanta Biosciences (http://www.vedantabio.com/) is tackling solid tumors with bacteria, Seres Therapeutics (http://www.serestherapeutics.com/) is optimizing fecal transplants to treat recurrent Clostridium difficile infections, and Blue Turtle Bio (http://blueturtlebio.com/) is also utilizing bacteria from the gut microbiome but as a drug delivery platform. A Swedish company, Infant Bacterial Therapeutics (http://ibtherapeutics.com/) (IBT), which is taking on necrotizing enterocolitis (NEC) with Lactobacillus reuteri-based candidates, has been granted the Rare Pediatric Disease Designation by the FDA for its lead drug candidate to prevent NEC – a disease, which is fatal, especially for premature neonates.
The modulation of the gut microbiota composition of infants and children has been investigated as a therapeutic route for atopic dermatitis, bacterial gastroenteritis, inflammatory bowel disease, necrotizing enterocolitis, and allergic diseases11. Probiotic interventions encourage the growth of commensal bacteria and ward off the colonization of pathogenic organisms, thereby affording protection to the intestinal barrier function and reducing food allergies and atopic disease incident rates12. Infant formula containing low dose Bifidobacterium lactis supplementation is shown to provide similar early life outcomes to breastfeeding with regards to gastrointestinal infection rates and immune system and gut maturation13. However, benefits of probiotic usage are not limited to infants.
The Probiotics in Pregnancy Study conducted in Wellington and Auckland, New Zealand involved the administration of Lactobacillus rhamnosus four hundred pregnant women during pregnancy and breastfeeding. This study showed reduced rates of infant eczema and atopic sensitization at 12 months but also decreased rates of material gestational diabetes mellitus and the presence of bacterial vaginosis and vaginal carriage of Group B Streptococcus, and postpartum depression and anxiety14.
The potential of leveraging the data that can be gathered through deep microbiome profiling is strong and is increasingly becoming a promising strategic approach for drug discovery and development companies to treat infant, pediatric, and adult diseases.
References
- Jandhyala, S. M., Talukdar, R., Subramanyam, C., Vuyyuru, H., Sasikala, M., & Reddy, D. N. (2015). Role of the normal gut microbiota. World Journal of Gastroenterology: WJG, 21(29), 8787. (https://www.ncbi.nlm.nih.gov/pmc/articles/PMC4528021/pdf/WJG-21-8787.pdf)
- Armougom, F., Henry, M., Vialettes, B., Raccah, D., & Raoult, D. (2009). Monitoring bacterial community of human gut microbiota reveals an increase in Lactobacillus in obese patients and Methanogens in anorexic patients. PloS one, 4(9), e7125. (http://journals.plos.org/plosone/article?id=10.1371/journal.pone.0007125)
- Brown, C. T., Davis-Richardson, A. G., Giongo, A., Gano, K. A., Crabb, D. B., Mukherjee, N., & Hyöty, H. (2011). Gut microbiome metagenomics analysis suggests a functional model for the development of autoimmunity for type 1 diabetes. PloS one, 6(10), e25792. (http://journals.plos.org/plosone/article?id=10.1371/journal.pone.0025792)
- Larsen, N., Vogensen, F. K., van den Berg, F. W., Nielsen, D. S., Andreasen, A. S., Pedersen, B. K., & Jakobsen, M. (2010). Gut microbiota in human adults with type 2 diabetes differs from non-diabetic adults. PloS one, 5(2), e9085. (http://journals.plos.org/plosone/article?id=10.1371/journal.pone.0009085)
- Weir, T. L., Manter, D. K., Sheflin, A. M., Barnett, B. A., Heuberger, A. L., & Ryan, E. P. (2013). Stool microbiome and metabolome differences between colorectal cancer patients and healthy adults. PloS one, 8(8), e70803. (http://journals.plos.org/plosone/article?id=10.1371/journal.pone.0070803)
- Zhang, Y. J., Li, S., Gan, R. Y., Zhou, T., Xu, D. P., & Li, H. B. (2015). Impacts of gut bacteria on human health and diseases. International journal of molecular sciences, 16(4), 7493-7519. (http://www.mdpi.com/1422-0067/16/4/7493)
- Jangi, S., Gandhi, R., Cox, L. M., Li, N., Von Glehn, F., Yan, R., & Cook, S. (2016). Alterations of the human gut microbiome in multiple sclerosis. Nature Communications, 7. (https://www.ncbi.nlm.nih.gov/pmc/articles/PMC4931233/)
- Cao, X., Lin, P., Jiang, P., & Li, C. (2013). Characteristics of the gastrointestinal microbiome in children with autism spectrum disorder: a systematic review. Shanghai Arch Psychiatry, 25(6), 342-53. (https://www.ncbi.nlm.nih.gov/pmc/articles/PMC4054584/)
- Lyte, M. (2013). Microbial endocrinology in the microbiome-gut-brain axis: how bacterial production and utilization of neurochemicals influence behavior. PLoS Pathog, 9(11), e1003726. (http://journals.plos.org/plospathogens/article?id=10.1371/journal.ppat.1003726)
- Brusca, S. B., Abramson, S. B., & Scher, J. U. (2014). Microbiome and mucosal inflammation as extra-articular triggers for rheumatoid arthritis and autoimmunity. Current opinion in rheumatology, 26(1), 101. (https://www.ncbi.nlm.nih.gov/pubmed/24247114)
- Awasthi, S., Wilken, R., German, J. B., Mills, D. A., Lebrilla, C. B., Kim, K., & Maverakis, E. (2016). Dietary supplementation with Bifidobacterium longum subsp. infantis (B. infantis) in healthy breastfed infants: study protocol for a randomised controlled trial. Trials, 17(1), 340. (https://www.ncbi.nlm.nih.gov/pmc/articles/PMC4957407/)
- Cao, S., Feehley, T. J., & Nagler, C. R. (2014). The role of commensal bacteria in the regulation of sensitization to food allergens. FEBS letters,588(22), 4258-4266. (https://www.ncbi.nlm.nih.gov/pmc/articles/PMC4216641/)
- Baglatzi, L., Gavrili, S., Stamouli, K., Zachaki, S., Favre, L., Pecquet, S., & Costalos, C. (2016). Effect of infant formula containing a low dose of the probiotic Bifidobacterium lactis CNCM I-3446 on immune and gut functions in C-section delivered babies: a pilot study. Clinical medicine insights. Pediatrics, 10, 11. (https://www.ncbi.nlm.nih.gov/pmc/articles/PMC4792197/)
- Barthow, C., Wickens, K., Stanley, T., Mitchell, E. A., Maude, R., Abels, P., & Hood, F. (2016). The Probiotics in Pregnancy Study (PiP Study):rationale and design of a double-blind randomised controlled trial to improve maternal health during pregnancy and prevent infant eczema and allergy. BMC pregnancy and childbirth, 16(1), 133. (https://www.ncbi.nlm.nih.gov/pmc/articles/PMC4891898/)
Editor’s Note: The original article first appeared on the Ocean Ridge Biosciences website, which, after the acquisition of Ocean Ridge Biosciences, was modified for use on the Frontage website.
Tissue biopsies, which are currently the gold standard molecular diagnostic technique for oncologists, are not only painful to cancer patients but expose an already immune-comprised population to increased rates of nosocomial infections. Furthermore, it is not uncommon for the typical clinical pathology workflow to yield samples that are not suitable for routine analysis strategies, e.g., next-generation sequencing (NGS), due to severe degradation. Therefore, researchers at Abramson Cancer Center at the University of Pennsylvania (ACC) are among the many investigators pursuing reliable noninvasive tests to replace traditional tissue biopsies for the detection of reliable biomarker signatures and clinically relevant mutations. Recently, results from a study evaluating cell-free circulating tumor DNA (ctDNA) with blood samples derived from 102 advanced non-small-cell lung cancer patients (NSCLC) were published in Clinical Cancer Research in an article entitled, “Detection of Therapeutically Targetable Driver and Resistance Mutations in Lung Cancer Patients by Next Generation Sequencing of Cell-Free Circulating Tumor DNA” (Thompson et al., 2016). Of the patients in the study, 96% had stage IV disease, 81% had adenocarcinoma tumors, and 68% were women.
The study compared results from sequencing of focused gene panels that were independently developed for the analysis of tissue DNA and ctDNA. The tissue DNA samples were analyzed at the University of Pennsylvania (UP) using either the Illumina TruSeq Amplicon Cancer Panel (covers hotspots or exons of 47 genes) or a smaller UP Precision panel covering the 20 most commonly mutated genes, depending on the amount of DNA available. The ctDNA was analyzed using 68 or 70 gene versions of the Guardant360 panel; the sample processing and sequencing were performed by Guardant Health. The Illumina MiSeq instrument was used for the tissue DNA amplicon sequencing using an unstated sequencing depth, whereas the ctDNA amplicons were sequenced to a depth of 10,000X depth using an Illumina HiSeq 2500. Given the 4.2X higher yield of nucleotides from a single lane of the HiSeq 2500 versus an entire MiSeq run, the sequencing depth was likely lower for the tumor DNA samples. Sequencing was successfully completed using ctDNA template for all 102 patients. In contrast, sequencing of tissue DNA was successful in only 49% of patients due to poor quality of specimens, insufficient DNA yield, or because tissue biopsies were unobtainable.
Learn more about Frontage’s Cell-free DNA Methylation Sequencing Services.
Assuming faithful representation of the tumor genomes in the circulating DNA, because of the lower number of genes sequenced as well as the likely reduced coverage depth for the analysis of tissue DNA versus ctDNA, one would expect that the number of known mutations identified in the ctDNA would be higher than in the tissue DNA when comparing the same samples. This expectation was borne out by the focused comparison of 50 patients for which both tissue DNA and ctDNA were analyzed. Of these 50 common patients, 78% had at least one variant call from tissue DNA versus 84% for ctDNA. In keeping with the larger gene panel size used for the characterization of the ctDNA, an average of 2.8 variants per patient were detected in the ctDNA versus 1.5 in the tissue DNA. The overall concordance between the two sample types for variant detection was 60% when considering only polymorphisms that were covered by both the ctDNA and tissue DNA panels. When narrowing the scope to the therapeutically targetable EGFR mutations, the overall concordance in polymorphism detection between the matched tumor and circulating DNA samples improved to 79%.
The lower-than-desirable concordance rate (60%) should not be taken to indicate limitations in the reliability of the sequencing-based tests. The authors provide several plausible reasons for the reduced concordance between the ctDNA and tissue DNA assays. First, the time between the collection of the tissue sample and the blood sample for the study was up to 2 years, and major changes in the genetic makeup of the tumor could occur during this time. Another reason for reduced concordance could be the differing contribution of specific tumor lineages to tumor versus circulating DNA; in general tumor DNA may be diluted by non-tumor circulating DNA in the blood leading to a reduced frequency of specific mutations. Conversely, cell types with specific mutations may more aggressively shed DNA in to circulation and therefore be over-represented in the ctDNA relative to the tissue DNA. Overall, these results contribute to the promise that as sequencing technology continues to advance with the ability to profile lower amounts of DNA, with coverage of greater numbers of genes at greater depth, patients will be able to benefit greatly from non-invasive monitoring of the genetic make-up of ctDNA. Further improvements in databases of actionable mutations will allow for better clinical decision-making based on the review of ctDNA sequencing results, ultimately improving patient survival and quality of life.
Editor’s Note: The original article first appeared on the Ocean Ridge Biosciences website, authored by Sheena Knight, which, after the acquisition of Ocean Ridge Biosciences, was modified for use on the Frontage website.
Through liquid biopsy, studying cfDNA informs us on various considerations for drug treatment.
Authors: David Willoughby, Jessica Sinha
Precision medicine has seen many improvements in the current clinical approaches, especially as liquid biopsy methods are being increasingly studied. Liquid biopsy, which is an alternative sampling method for circulating macromolecules, has a particular emphasis on nucleic acids. Of particular interest is cell-free DNA (cfDNA), which is the extracellular DNA circulating in body fluid and can be derived from both normal and diseased cells and has the potential to be used as biomarkers. Patients who are likely to respond and those who do not respond to a drug treatment during a late-stage clinical trial may be distinguished by an assay for specific biomarkers in a process termed patient stratification. With improvements seen in next-generation sequencing (NGS) tools, successful sequencing of cfDNA analysis is possible. It is informative in various areas, from learning about mutations to monitoring targeted drug resistance.
For more on the current state and future of Precision Medicine and Companion Diagnostics, watch our panel discussion with Frontage expert, Dr. Kai Wang.
Liquid Biopsy: A Tool for Sampling Biomarkers
Liquid biopsy is a method of biomarker sampling that minimizes invasiveness, allows for routine sampling, and is associated with the analysis of circulating macromolecules with a particular emphasis on nucleic acids. Serum and plasma are the most common sample types, but urine, saliva, and other bodily fluids can also be used. Liquid biopsy is used for the determination of diagnosis or prognosis and to facilitate informed treatment decisions. Types of molecules that can be analyzed in liquid biopsy samples include lipids, carbohydrates, small biomolecules, proteins, circulating nucleic acids, or tumor cells. Particularly the circulating DNA and RNA assayed can be informative about a disease or drug therapies. However, for solid tumors or more organ-specific diseases, cfDNA or RNA is typically much more informative.
Methods for Cell-Free DNA Analysis
Frontage offers various methods to analyze cfDNA:
- Droplet digital PCR helps accurately measure copy number changes, single nucleotide polymorphisms (SNP), and small insertions/ deletions (indels) for one or a few loci.
- Real-time PCR monitors SNPs, indels, conserved translocations, and methylation changes for one up to a few hundred specific sites (with qPCR panels). This method is highly sensitive with a wide dynamic range and can detect an extremely low % of variants in a population. However, this method is best suited for 1 or a few loci, though there are technologies that offer panels to run for multiple loci.
- Sequencing Techniques
- Whole genome sequencing is used mainly for the detection of major chromosomal rearrangements, deletions, and hypomethylation. This is not practiced for most applications for cfDNA given the non-uniform coverage of cfDNA.
- Amplicon sequencing is a low-cost and rapid procedure to target up to 200 genomic regions with commonly occurring polymorphisms that inform treatment decisions. Tumor mutational burden and microsatellite instability can also be determined.
- Hybridization-based capture sequencing allows high-depth sequencing of up to 100 million nucleotides from the human genome. This technique also enables the detection of potentially pathogenic SNP and indels, as well as some large deletions and gene fusion events.
- Methylation sequencing checks the methylation of cytosine residues in the DNA.
Major Challenges with cfDNA Sequencing
- Low and variable yield of cfDNA: 10 nanograms of DNA, equivalent to 1520 diploid genomes, is the absolute minimum mass for reliably successful detection of somatic polymorphisms.
- Low percentage of circulating tumor DNA relative to total cfDNA: The percentage of tumor-derived DNA in circulation may be as low as 1%. One must sequence deep enough and use strong methods to prevent DNA loss during library preparation (point #4).
- Poor sample quality due to blood sample handling: This can cause contamination with DNA derived from the lysis of hematopoietic cells and inefficient removal of platelets.
- Loss of DNA during the preparation of libraries for sequencing: DNA loss during processing reduces the number of unique sequencing molecules represented in the sequencing library.
Frontage teams utilize commercially available amplicon- and hybridization-capture-based multigene sequencing panels from Illumina, Invitae, and other suppliers as well as custom sequencing panels focused on key target genes. A broad range of analysis capabilities such as droplet digital PCR (ddPCR) and qPCR are also available to Sponsors that choose Frontage.
If you’re enjoying this article, check out our Cell-Free DNA Methylation Sequencing services.
Conclusion
Analysis of cell-free DNA has been evaluated and studied in many fields from precision medicine, oncology, prenatal medicine, and transplant medicine, to cardiovascular diseases. Cell-free DNA analysis is an exciting space in the current drug development and diagnostic space, and cfDNA tests are being developed by many molecular diagnostics companies, the first ones being approved by the FDA in 2020: Guardant 360 CDx and FoundationOne Liquid CDx tests. Analyzing cell-free DNA enables better targeting of the populations that would respond best to the drug and has tremendous value in the early development of companion diagnostics. The rapid development of new molecular techniques propels the various uses and applications of cfDNA. Not only does it open doors to minimally invasive diagnostics, but it also delivers promising data that could improve clinical decision-making and support closer monitoring of drug responses.
Contract Research Organizations like Frontage assist sponsors with cfDNA analysis during clinical trials. Some common applications of cfDNA analysis are:
- Identification of classes of polymorphisms and mutated genes associated with experimental anti-tumor drug efficacy
- Identification of surrogate biomarkers of anti-tumor drug efficacy
- Companion diagnostics development
Frontage provides a wide array of genomic services for protein-, oligonucleotide-, gene-, and cell-based therapeutic discovery and development, and complete solutions for the analysis of RNA expression, DNA polymorphisms, methylation, microbial composition, and protein biomarkers. Our labs are optimized for ultra-low input requirements and challenging sample types, supporting mechanisms of action, lead optimization, biomarker discovery, and the development of companion diagnostics.