Category: Bioanalytical
Microsampling Overview
Dried blood spots (DBS) and capillaries/capillary microsampling are the two most used microsampling techniques. In this article, we will give an overview of current microsampling techniques, the advantages, and challenges involved, and showcase how microsampling can generate high-quality bioanalytical data and accurate TK/PK profiling. Microsampling is a process through which low-volume samples (<100 μL) of fluid from the human body are captured for analysis. This enables minimally invasive analyses of samples when they are present in low volumes.
First used by Dr. Robert Guthrie for detecting metabolomic disorders in newborns in the 1960s, the dried blood spot (DBS) technology allowed routine neonatal testing for phenylketonuria (PKU) worldwide. In the drug discovery world, DBS was not considered for pharmacokinetic/toxicokinetic (PK/TK) studies until recently. In a 2010 study, a 10-time-points serial mouse PK study was done using microsamples and DBS, showing that serial microsampling and DBS provided quality serial PK profiling data in comparison with plasma-based composite studies. It was determined over time that DBS can reduce the sample volume needed by 75% and generate reliable PK data for use.
Microsampling in Bioanalysis
Current pharmacokinetic and toxicological studies have an increasing demand for the volume of blood required from study animals, especially when the study involves small rodents. A typical toxicology study has satellite groups of rodents, with each group having multiple animals, to achieve enough volume for analysis. Individual variance between animals can be high and animal physiology is affected at each draw. Altogether these affect the accuracy and efficiency of the studies.
The FDA ICH M3 guidance recommends a reduction of “[…] the use of animals in accordance with the 3R (reduce/refine/replace) principle” and microsampling techniques help preclinical researchers follow this. As a response, microsampling techniques have been introduced into bioanalytical studies. In a poll conducted during our webinar on DBS and Capillary Microsampling, a majority of the respondents reported ethical concerns and efficiency to be their drivers of interest in microsampling for bioanalysis.
Advantages of Microsampling
Previous studies have shown that microsampling greatly reduces blood sample volume needed by 80%. Because of this, fewer rodents are needed when conducting toxicokinetic (TK) studies, a number reduced by 75%. This reduction has allowed for serial TK/PK profiling, whereas when conventionally used plasma samples were collected, only composite profiling had been possible. During composite profiling, several animals need to be bled at different time points, and the large variability between animals added another factor to consider. Serial profiling also allows the generation of much more reliable and consistent PK profiles. For clinical studies, DBS sampling is especially patient-friendly for pediatric or studies with critically ill patients.
Handling DBS samples is also much simpler than traditional procedures. There is no centrifugation needed as is required when harvesting plasma and there are no requirements to aliquot or freeze samples as with plasma, saving freezer space and eliminating the need for cold storage during shipment. DBS sampling is also a safe technique because all pathogens, including HIV and HepB, are inactivated upon contact with the filter paper used. This ensures as well that the personnel handling the DBS samples are also safe. The costs of such methods are not low simply because of a reduction in R&D costs due to low volumes and fewer rodents needed. In fact, because DBS samples are not considered biohazardous and do not require special carriers, shipping costs are lower than they would be for plasma samples.
Challenges of Microsampling
In a poll conducted during our webinar on DBS and Capillary Microsampling, greater than 60% of the attendees reported “sample size” as their biggest challenge during method development for microsample bioanalysis. While assaying with smaller sample volumes is desirable for many reasons, the low volume limits sensitivity testing.
60% of the attendees reported “sample size” as their biggest challenge during method development for microsample bioanalysis.
Frontage Webinar Respondents, DBS and Capillary Microsampling
Differences in the sample quality can also be seen in spot-to-spot variation. The hematocrit (Ht) effect refers to the volume of red blood cells in the blood sample which can affect how well the blood spreads on the filter, causing the spot size to be either bigger or smaller. This can affect the quality and reliability of the blood samples as well as the quantification of the sample.
While most compounds are stable in DBS, compound stability can be an issue when handling compounds that are unusual or unstable. In such cases, applying inhibitors or stabilizers is inconvenient due to the design.
Choose a Partner with Microsampling Experience
When assessing DBS for LC-MS/MS method validation, it is critical not only to validate the parameters traditionally validated for plasma samples but also to additionally evaluate the spot size, sampling location, and hematocrit effect. DBS is a special kind of matrix because, unlike other matrices, it cannot be simply vortexed or diluted and homogeneity is difficult to ensure. At Frontage, we have developed special preparation and extraction techniques to prepare standards and QCs to ensure robust performance and produce clean data when working with microsampling techniques. We have developed a unique sample-handling method utilizing pre-scored capillaries developed in-house, at Frontage Laboratories (PA, USA). Learn more by reading our case study on this technique, and how it overcomes some of the limitations of the conventional capillary microsampling approach and supports regulated bioanalytical studies.
Case Study: Capillary Microsampling (CMS) Technique for Low-Volume Bioanalytical Plasma Analysis in Support of a Regulated Study: Frontage bioanalytical scientists developed a novel procedure for the collection and isolation of microvolumes of plasma using plastic instead of glass capability tubes to overcome issues associated with the typical glass CMS technique.

Dr. Santosh Shah
Director, Biologics, Frontage Laboratories
Dr. Santosh Shah is the Subject Matter Expert and Director of Biologics, at Frontage Laboratories. He has been providing scientific leadership and has been contributing to the development of the Global Biologics Strategy. He works as a liaison between business development, operations, and various other departments. He is also involved with communicating, auditing, and presenting bioassay capabilities (PK, ADA, NAb, Biomarker) to the pharma sponsors. He has been leading the automation development team at Frontage. Dr. Shah discovered several highly potent, copper-mediated, drug compounds against M. tuberculosis and S. aureus during his Postdoctoral Fellowship at the University of Alabama at Birmingham. During his Ph.D. at the University of Arizona, he dedicated himself to understanding the structure-function relationships of DNA nucleases.
Critical reagents for ligand binding assays (LBA) are essential components of bioanalytical testing. These include but are not limited to antibodies used as positive controls, capture, or detection reagents; peptides as drug targets; reference standards as test analytes for pharmacokinetics; positive controls for immunogenicity studies and matrices.
Critical reagents are crucial for assay performance and data comparability across different laboratories and countries since they directly impact the results of an assay. Thus, they need to be well characterized and validated for the proper execution of preclinical and clinical studies. Critical reagent stocks must also be maintained, and their sources recorded. Below is a snapshot of some of the key questions asked on the webinar, General Practices for Critical Reagents Usage in Bioanalytical Labs.
In the following Q+A, Dr. Santosh Shah, Director of Biologics, answers key questions on critical reagent usage in bioanalytical laboratories.
What approach would you use to bridge reference standards if you want to compare head-to-head, old, and new curves and full complement of quality controls (QC): LLOQ, LQC, MQC, HQC, ULOQ?
We set up two sets of plate controls (i.e., one set = one set of standards and two sets of QCs) each prepared with two different lots separately, and check the following results:
For each set, if standards and QCs meet the acceptance criteria.
If one lot of prepared QC meets the acceptance criteria in comparison to another lot of prepared standards.
Preparing from an old and new batch of reference standards will not fit on a 96-well plate, if there is the need to include three replicates of each. Is just running one or two replicates a valid approach so all five levels of QCs can be tested?
Our most common practice is to use two replicates. If three replicates are required, we use two plates to complete the comparison of reference standards.
Do you have a standard expiry assigned to different types of critical reagents, since often the stability is not known initially? Would you be willing to share your approach for being able to assign the expiry or retest/recertification dates initially?
For critical reagents acquired from external sources, we use expiry dates from certificates of analysis (COAs) provided by the sponsor/vendor. For critical reagents prepared in-house, we usually follow our standard operating procedure (SOP) based on the type of reagent, e.g., for an antibody-based critical reagent, we assign a 1-year expiry and retest annually.
How do you apply the correction factor, as you see >20% QC bias between using two different lots of reagents? In other words, will the correction factor be applied to assay modification or study data?
The correction factor is usually used when bridging sample analysis kits, in which standards and buffers are included for standard calibrators and QCs preparation. From kit to kit, the buffer and standard material are different to a certain extent and the overall comparison in QCs will be greater than individual standard material lots. The correction factor will be applied to the study data, not the assay.
Can you speak on extending expiration dates via retesting?
We perform one run with one set of standards and two sets of QCs (HQC, MQC, and LQC) loaded to plates in duplicate. If the run passes, the expiration may be extended for a time equal to the original time interval.
What is the purpose of BIO-006 Change Control Procedure?
BIO-006 Change Control Procedure SOP provides a procedure for managing document and equipment changes at Frontage Laboratories. It outlines the method of documenting and controlling changes to issued documents and equipment, as well as tracking changes.
What should the re-testing frequency for in-house conjugated reagents, e.g., biotinylated drug or digoxin drug, be?
We usually retest once a year since the labeled reagents tend to become aggregated, leading to a higher signal over time. This change is more detrimental to ADA studies in which the raw data are evaluated for positiveness and titer of the ADA confirmed. We would rather re-label reagents than re-testing the regents.
- Watch the complete webinar: General Practices for Critical Reagents Usage in Bioanalytical Labs.
- Watch the industry’s leading bioanalytical experts discuss the trends in LBAs and critical reagents in our panel discussion: Utilizing Ligand Binding Assays (LBA) and Critical Reagents for Drug Development.
Frontage’s biologics teams have nearly 15 years of experience in complex drug development and large molecule applications throughout its evolution in product development. We have handled projects for peptides, proteins, monoclonal antibodies, bispecific antibodies, biosimilars, oligonucleotides, biomarkers, and antibody-drug conjugates. Contact our sales team for your biologics projects.
Note: This feature includes the webinar, panel discussion, and Q+A, and was done in association with Bioanalysis Zone.
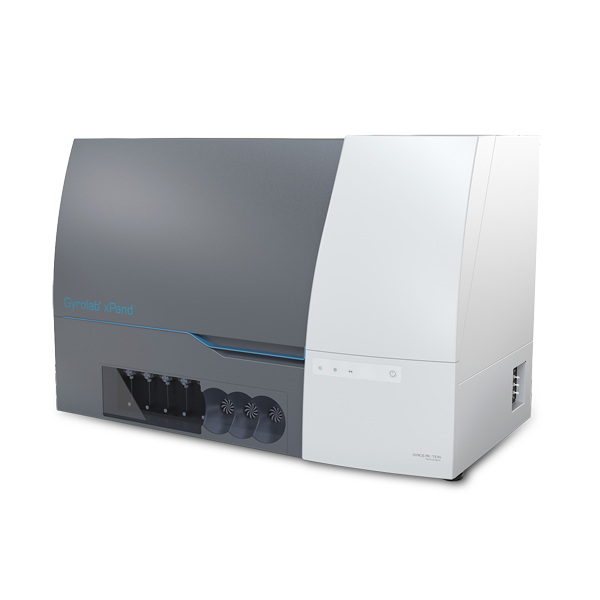
Gyrolab: The Platform
Gyros Protein Technologies AB developed Gyrolab platforms using “reproducible nanoliter microfluidics and sequential CD processing” for efficient immunoassay runs. The first immunoassay system for nanoliter-scale protein quantification was released in 2003 at Drug Development Tool (DDT), Boston. In 2009, Gyrolab xP launched a new software designed for 21 CFR part 11 compliance and extended validation support. It miniaturizes immunoassay and integrates reagents (capture and detection antibody), sample addition, and CD washing into a single machine. For pharmacokinetic (PK) studies, it has brought advantages like broader dynamic ranges, shorter time to results, reduced sample and reagent volumes, and automated programs.
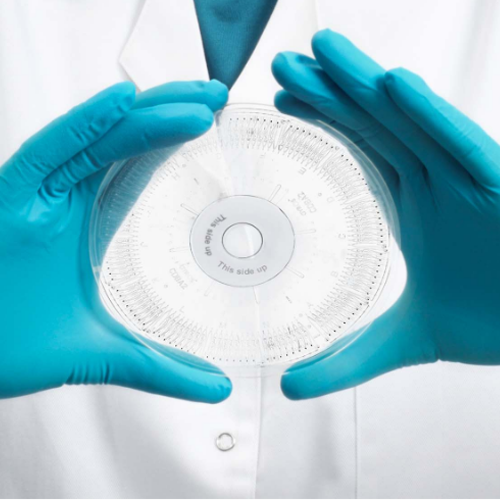
Gyrolab Design
The Gyrolab system works with its proprietary CD technology engineered with highly reproducible nanoliter microfluidics. Each CD has 96/112 channels depending on the CD type and each channel has an individual sample addition inlet. Through precise, automated control of CD spin, capillary forces steer liquid flow through nanoliter-scale microfluidic structures in each CD channel and form the sandwich format. Fluorescence data is collected from the assay and analyzed using the Gyrolab Evaluator software to obtain final protein concentrations.
Challenges and Advantages of Gyrolab
Different from MSD and ELISA platforms, which use disposal tips to transfer reagents and samples, Gyrolab uses needles to transfer samples. Because of the instrument’s design, carryover contamination checks are necessary to conduct during method validation. For optimal use of Gyrolab, Frontage’s bioanalytical team shows how carryover contamination checks can be performed to ensure smooth operation.
Unlike the MSD and ELISA platforms which can handle multiple plates parallelly, Gyrolab processes CDs in a sequential manner. One CD run can take 1 to 2 hours, and the last CD needs to wait about 4 to 8 hours on the machine to be processed. In this case, samples after MRD benchtop stability need to be established to make sure samples are stable on Gyrolab while waiting for analysis. For optimal use of Gyrolab, Frontage has performed “After MRD (minimum required dilution)” stability testing to mimic the delay in loading standards.
No doubt, the Gyrolab platform has several advantages over ELISA or MSD platforms. The broader standard curve range and the proprietary CD technology which uses affinity flow-through assay reduce the background noise significantly and increase the sensitivity. It runs in a shorter amount of time and can utilize smaller sample and reagent volumes, saving critical reagents. An ideal choice for preclinical drug development animal assays, which have limited sample volume, it is also suitable for clinical projects with many samples that need to be analyzed in a short time.
Using Gyrolab for Your Immunoassays
With an increased need for high-throughput immunoassays using precious samples and uncompromised data quality in a limited time, choosing a CRO that can build quality assays and deliver robust data is critical. Frontage’s Gyrolab team has deep expertise in analyzing any peptide, protein, or antibody, and with method validation using the Gyrolab platform under GLP or Clinical environments.
Author’s Note: This article is written with support from Zhongqiang Qiu, Ph.D. from Biologics Service at Frontage Laboratories.

Adopted on May 24, 2022, the International Council for Harmonisation (ICH) has released a new guideline to standardize bioanalytical method validation (BMV) practices.
Until recently, different global regulatory agencies had varying requirements for validating bioanalytical methods and performing sample analysis.
Now, the International Council for Harmonisation (ICH) has released a new guideline that aims to standardize bioanalytical method validation (BMV) practices. [1] The final step 5 ICH M10 guideline, adopted on May 24, 2022, has been ratified by various regulatory agencies including the U.S. Food and Drug Administration (FDA). For the EU’s European Medicines Agency (EMA), the ICH M10 will be coming into effect on January 21, 2023.
As already stated in global white papers [2,3] published after the public consultation period, ICH M10 does not seem to require significant changes compared to previous guidance/guidances. [4,5] Indeed, a white paper summarizing the 2019 Workshop on Recent Issues in Bioanalysis (WRIB) stated that the new guidance “has already been positively received by the global bioanalytical community and only a few major topics were identified which required further discussion.” [2]
Some recommendations may result in minor changes for certain types of validation tests and sample analysis procedures. Hence, it is important to work closely with a contract research organization (CRO) that is at the forefront of understanding and implementing these changes so you can continue to meet industry and regulatory standards without experiencing major disruptions in your projects.
For example: [1]
- In the 2018 FDA guidance [4], the lower limit of quantification (LLOQ), low-, mid-, and high-range quality control (QC) samples are recommended for accuracy and precision runs. ICH M10 specifies that for chromatography method validation, low-range QCs should fall within three times the LLOQ, mid-range QCs should be about 30 – 50% of the calibration curve range, and high-range QCs should be at least 75% of the upper limit of quantification (ULOQ). Ligand binding assays, on the other hand, require using the geometric mean of the calibration curve range for the mid-range QC sample.
- ICH M10 stipulates that QC samples must always bracket study samples, whereas the previous FDA guidance did not contain this requirement.
- Chromatography dilution QC samples need to be included during sample analysis. They must have a concentration that surpasses that of the diluted study samples. Alternatively, they need to have a higher concentration than the ULOQ. ICH M10 also states that if dilution QC samples for ligand binding assays have a concentration that exceeds the ULOQ, the concentration of the QC samples should be adjusted to represent the actual sample concentration range.
- The former FDA guidance required incurred sample reanalysis (ISR) for bioequivalence or pivotal pharmacokinetic or pharmacodynamic studies. ICH M10 also requires ISR for bioavailability studies, first clinical trials, pivotal early patient trials, and first trials in patients with impaired renal or hepatic function.
ICH M10 also includes slightly altered requirements for documentation and reporting. In some cases, additional data will need to be provided to regulatory agencies. For example, when performing comparative bioavailability and bioequivalence studies, the bioanalytical report needs to provide internal standard response plots from all runs. This also applies to failed runs. [1]
Some additional updates in M10 relative to the 2018 FDA guidance:
- The 2018 guidance specifies fresh QCs for P&A while M10 doesn’t but rather specifies fresh calibrators
- M10 has a section on analytes that are also endogenous but biomarkers are out of scope while the 2018 guidance has a small section on biomarkers
- M10 has overall acceptance criteria across runs for sample analysis data, consistent with the EMA guidance but not previously an FDA requirement
- The 2018 guidance was not specific about evaluating hemolysis or lipidemia. M10 has 1 lot of each in addition to the 6 selectivity lots.
- M10 has more detail on cross-validations
- M10 discusses dilution QCs in sample analysis including multiple dilutions in a run should have QCs at the highest and lowest dilutions
Other minor changes reflect current industry standards. For example, ICH M10 clarifies that the guideline was developed to support performing animal studies that follow the 3Rs — Reduce, Refine, and Replace. [1]
Frontage has expertise in carrying out studies according to the most recent bioanalytical method validation guidance/guidances across global markets. Contact us to learn more about our state-of-the-art bioanalytical solutions and discover how we can help you become compliant with ICH M10.
References
- Bioanalytical Method Validation and Study Sample Analysis: M10. International Council for Harmonisation of Technical Requirements for Pharmaceuticals for Human Use. Adopted May 24, 2022. Accessed October 14, 2022. https://database.ich.org/sites/default/files/M10_Guideline_Step4_2022_0524.pdf
- 019 White Paper On Recent Issues in Bioanalysis: FDA BMV Guidance, ICH M10 BMV Guideline and Regulatory Inputs: https://www.future-science.com/doi/pdf/10.4155/bio-2019-0270
- GCC Consolidated Feedback to ICH on the 2019 ICH M10 Bioanalytical Method Validation Draft Guideline: https://www.future-science.com/doi/pdf/10.4155/bio-2019-0207
- Bioanalytical Method Validation: Guidance for Industry. U.S. Food and Drug Administration. Published May 2018. Accessed October 14, 2022. https://www.fda.gov/files/drugs/published/Bioanalytical-Method-Validation-Guidance-for-Industry.pdf
- Guideline on Bioanalytical Method Validation. European Medicines Agency. Published July 21, 2011. Accessed October 14, 2022. https://www.ema.europa.eu/en/documents/scientific-guideline/guideline-bioanalytical-method-validation_en.pdf